VESDA Fire and Oxygen Monitor
- The VESDA computer is located on a small table behind the console by the Large Target Room entrance.
- The VESDA system monitors smoke concentrations in the Vault, Tunnel, Small Target Room, Large Target Room, Control Room, and Dock. These systems are very sensitive to smallest concentrations of smoke, dust, steam, or any other particulate. Smoke concentration levels are connected to the main Fire Alarm System.
- The VESDA system also monitors Oxygen concentrations in the pit below the accelerator and on the Dock, the two places where SF6 could accumulate if released.
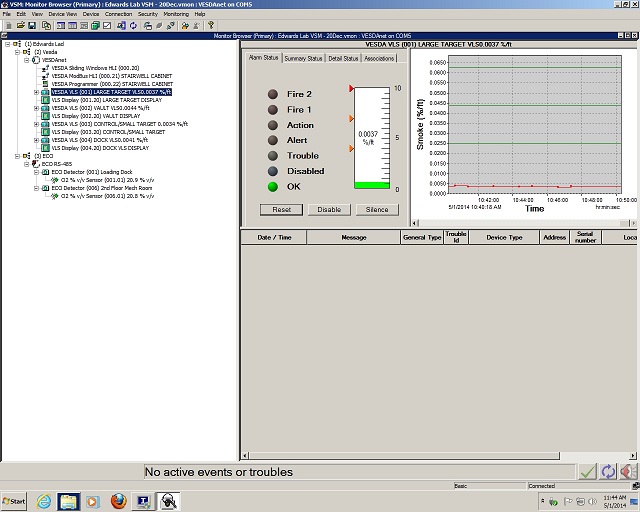
- The VESDA computer display looks like this:
- The devices that make up the VESDA system are listed in the left pane of the display. The upper part of the list under “vesda” is for the smoke detection system, the lower part of the list under “ECO” is for the oxygen detection.
- When you click on a device in the list (Large Target Room smoke is selected in the picture) the status window for the device will appear in the upper right pane. The status graph will show you several things:
- The graph shows the device behavior over the last hour or so and continuously updates.
- The red line in the plot is the detected value of smoke or oxygen.
- The green lines are event thresholds. If the red line crosses a green line an event will be triggered.
- For smoke:
- The red line should normally be at the bottom of the graph. It is normal to oscillate some.
- The lowest green line will generate a trouble condition on the fire alarm panel. The trouble message will indicate which detector and which pipe on the detector is seeing smoke.
- The middle green line will generate a supervisory condition on the fire alarm panel. The supervisory message will indicate which detector and which pipe on the detector is seeing smoke.
- The upper green line will generate a fire alarm. The fire alarm message will indicate which detector and which pipe on the detector is seeing smoke.
- For oxygen levels:
- The red line should normally be at about 21%, the normal amount of O2 in air, and should be above the green lines in these detectors.
- The upper green line is the warning threshold that O2 levels are reduced but not dangerous. The computer will play a recorded message on the speakers that minor low oxygen levels have been detected.
- The lower green line is the warning threshold that O2 levels are reduced to a life threatening level. The computer will play a recorded message on the speakers that major low oxygen levels have been detected and a Supervisory Trouble will appear on the Fire Alarm System.
- The lower right pane will display a list of events for that detector. In addition to actual detections, and event may also be generated by system trouble. For example, “low air flow”, or “calibration due”.
- Any events on the VESDA systems will automatically email Don and text/email Devon.
- Any events on the smoke detection devices will appear on the main fire alarm system.
- Any trouble events on the O2 detectors appear on the computer and the Fire Alarm System. Both low oxygen events appear on the computer and play messages on the computer speakers, and major low oxygen events appear on the Fire Alarm System as Supervisory.
- Any smoke events that caused trouble or supervisory conditions on the fire panel may be cleared by Devon or Don after the smoke levels return to normal values below the green lines.
- Any smoke events that cause a fire alarm may only be cleared after smoke levels return to normal or after Devon or Don disable that particular detector. Facilities management or the Fire Department will have to reset the main fire panel.
